Breast Cancer Statistics
Rates of breast cancer vary among different groups of people. Rates vary between women and men and among people of different ethnicities and ages. They vary across the U.S. and around the world.
This section provides an overview of breast cancer statistics for many populations. Click on any of the topics below to learn more.
Breast cancer incidence rates over time
In the 1980s and 1990s, the rate of breast cancer incidence (rate of new cases) rose, largely due to increased breast cancer screening with mammography [222].
The rate of breast cancer incidence declined in the early 2000s [222]. This decline appears to be related to the drop in menopausal hormone therapy use after it was shown to increase the risk of breast cancer [62,222].
Mammography screening rates also fell somewhat in the early 2000s. However, studies show the decline in the rate of breast cancer incidence during this time was not likely due to the decline in screening rates [62-63].
From 2012 to 2021 (most recent data available), overall breast cancer incidence rates have increased by 1% per year [223]. Rates varied somewhat among age groups. Among women 50 and older, rates of invasive breast cancer increased by less than 1% per year and among women younger than 50, rates increased by just over 1% per year [222,224].
The increase in breast cancer incidence over time may be due, in part, to an increase in body weight and a decline in the number of births among women in the U.S. over time [64].
Trends in incidence rates of breast cancer may be different among some groups of women.
Breast cancer mortality rates over time
From 1989 to 2022 (most recent data available), the breast cancer mortality (death) rate in U.S. women decreased by 44% due to improved breast cancer treatment and early detection [196].
Since 1989, about 517,900 breast cancer deaths in U.S. women have been avoided [222].
The breast cancer mortality rate in women decreased by about 1.5% per year from 2018 to 2022 [197]. Different breast cancer mortality rate trends may have been seen in some groups of women.
Mammography and rates of early detection over time
During the 1980s and 1990s, diagnoses of early-stage breast cancer in the U.S., including ductal carcinoma in situ (DCIS), increased greatly [222]. This was largely due to the increased use of screening mammography during this time [222].
Almost all cases of DCIS are diagnosed with screening mammography [222]. So, rates of DCIS increased greatly after screening mammography became widespread. Among women 50 and older, rates of DCIS increased from 7 cases per 100,000 women in 1980 to 73 cases per 100,000 women in 2000 [144]. From 2012 to 2021, rates of DCIS were stable [222].
During the COVID-19 pandemic, rates of screening mammography declined in some groups [178].
Race/ethnicity and breast cancer incidence rates over time
The overall incidence rate of breast cancer (rate of new cases) is higher among white women than among Black women [198,237].
From 2017 to 2021 (most recent data available), the incidence rates of breast cancer in white women and Black women increased slightly (by less than 1% per year) [199].
Learn more about race/ethnicity and breast cancer risk.
Race/ethnicity and breast cancer mortality rates over time
From 2018 to 2022 (most recent data available), the mortality (death) rate from breast cancer declined for both white women (by about 1% per year) and Black women (by 1.5% per year) [200].
However, the breast cancer mortality rate from 2018 to 2022 (most recent data available) was about 37% higher for Black women than white women [201].
Figure 1.2 (below) shows the breast cancer mortality trends for Black women and white women.
Learn more about the disparities in breast cancer mortality rates between Black women and white women.
Learn more about race/ethnicity and breast cancer risk.
Figure 1.2

Age-adjusted to the 2000 U.S. standard population.
Source: 1975-2022 SEER data, 2024 [202-203]
Breast cancer rates in men over time
From 2017 to 2021 (most recent data available), the breast cancer incidence rate in men increased slightly (by less than 1% per year) [194].
The breast cancer mortality rate in men remained stable from 2018 to 2022 (most recent data available) [195].
Learn more about breast cancer in men.
Read our blog, Komen Answers a Global Call to Action for Breast Cancer Patients.
Breast cancer incidence (new cases) rates worldwide
Breast cancer is the most common cancer in women worldwide.
It’s estimated more than 2 million new cases of breast cancer occurred worldwide in 2022 (most recent data available) [76].
Breast cancer incidence rates around the world vary
In general, rates of breast cancer are higher in developed countries (such as the U.S., England and Australia) than in developing countries (such as Ethiopia, Nigeria and Pakistan) [76].
Figure 1.3: Breast cancer incidence rates worldwide
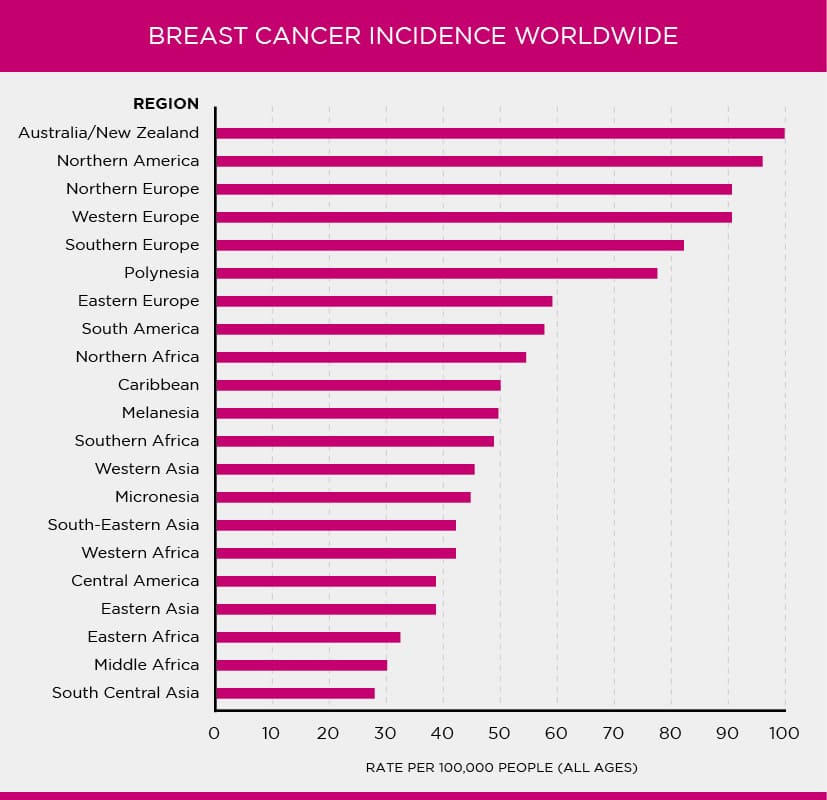
Source: International Agency for Research on Cancer (IARC) and World Health Organization (WHO) [76]
Lifetime risk of breast cancer worldwide
Women who live in developed countries tend to have a higher lifetime risk of breast cancer than women who live in developing countries [76-77].
Although we don’t know all the reasons for these differences, lifestyle and reproductive factors likely play a large role [77].
Low screening mammography rates and incomplete reporting can make rates of breast cancer in developing countries look lower than they truly are and may also explain some of these differences.
Figure 1.4: Lifetime risk of breast cancer worldwide
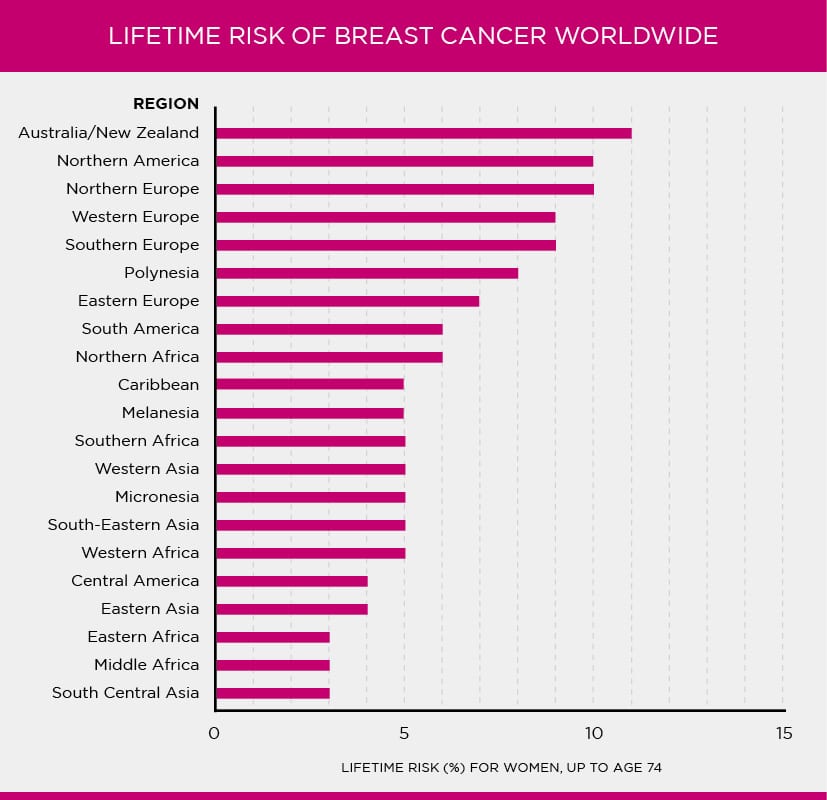
Source: International Agency for Research on Cancer (IARC) and World Health Organization (WHO) [79]
Learn more about lifetime risk of breast cancer in the U.S.
Breast cancer mortality (death) rates worldwide
Breast cancer is the leading cause of cancer mortality (death) among women in most countries in the world [183].
It’s estimated more than 660,000 breast cancer deaths occurred worldwide in 2022 (most recent data available) [183].
Rates of breast cancer mortality vary around the world
Breast cancer is the most common cause of cancer mortality among women in developing countries (such as Ethiopia, Nigeria and Pakistan) [77,184].
Breast cancer is the second most common cause of cancer mortality (lung cancer is first) among women in developed countries (such as the U.S., England and Australia) [77,185].
Among women in the U.S., rates of breast cancer incidence (new cases) and mortality (death) vary by race and ethnicity.
Figure 1.7
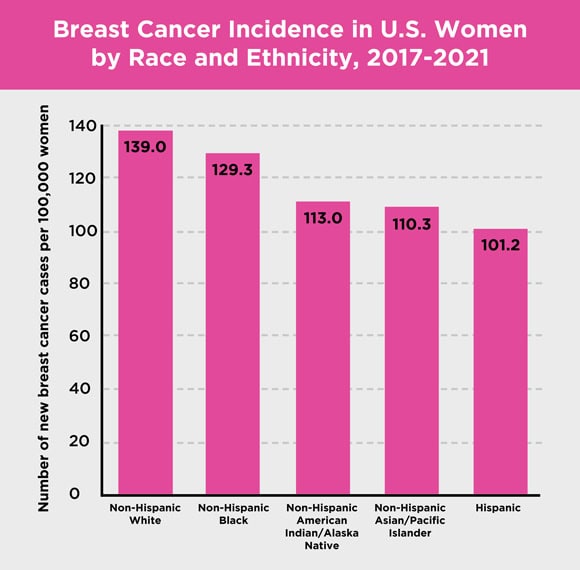
Source: 2017-2021 SEER data, 2024 [198]
Non-Hispanic white women and non-Hispanic Black women have the highest rates of breast cancer incidence overall [198]. Hispanic women have the lowest [198].
Figure 1.8

Source: 2018-2022 SEER data, 2024 [201]
Non-Hispanic Black women have the highest breast cancer mortality rate overall [201]. Non-Hispanic Asian and Pacific Islander women have the lowest [201].
Click on the topics below to learn more about rates of breast cancer incidence and mortality among women of different races and ethnicities.
Updated 04/10/25
This content is regularly reviewed by an expert panel including researchers, practicing clinicians and patient advocates.